By Mike Carnes, Managing Director – MIAC MSR Valuations Group
Fair Market Value Update
In anticipation of the Fed’s recent 25 bps rate cut, mortgage rates had already been trending lower. MIAC’s Base Mortgage Rate declined from 6.60% at the end of June to 6.37% at the end of August and now sits at 6.13% post-cut. The nearly 50 bps decline relative to only a 25 bps Fed adjustment suggests that markets may already be pricing in the possibility of additional cuts in 2025.
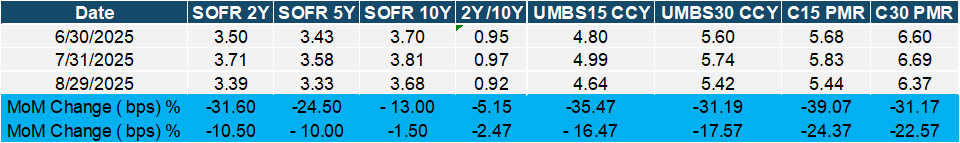
Source: MIAC Analytics – CCY data derived from MIAC’s proprietary TBA Fixings™ and CCY Fixings™ platforms.
For MSR holders, this environment may translate into lower valuations as prepay expectations rise, while at the same time creating opportunities to assess execution levels in the bulk market. A key dynamic has been the divergence in performance between higher- and lower-WAC MSRs.
- Higher-WAC MSRs have been more sensitive to rate declines, as steeper prepayment curves increase refinancing activity. These portfolios have drawn interest from buyers with established recapture platforms, who often assign value to the potential incremental revenue from retained borrowers.
- Lower-WAC MSRs remain in demand from investors that place less emphasis on recapture. Their appeal lies in the extended economic life and relative stability of the servicing cash flows. Even with some compression in float income, lower-WAC MSRs are generally more insulated from accelerated prepays, making them attractive for those seeking longer-duration, lower-convexity profiles.
For institutions without recapture capabilities, one potential strategy is to evaluate sale opportunities in a competitive bid environment, particularly for higher-WAC profiles or under LOCOM accounting. Lower-WAC portfolios may appeal to a different buyer segment, offering an additional path for execution.
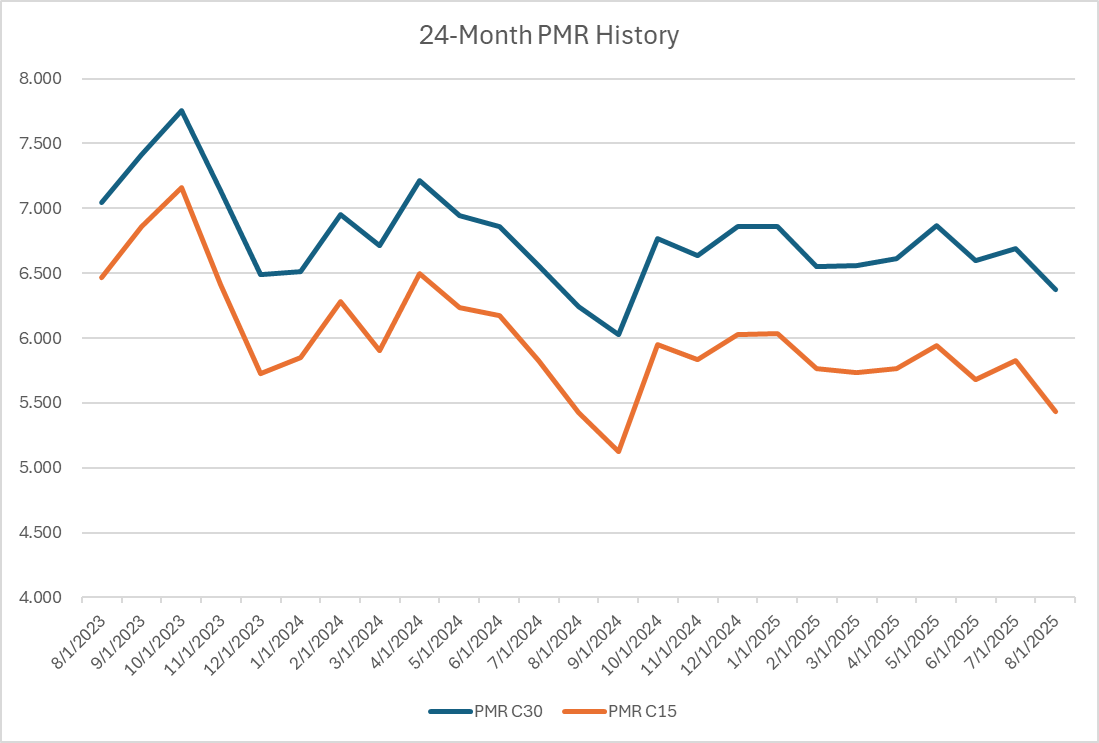
Source: MIAC Analytics™
MIAC’s Retrospective Analysis: Attribution Framework
MIAC’s Retrospective Analysis provides a detailed evaluation of the performance of MSR and/or hedge positions over a defined period (daily, weekly, or monthly). The framework attributes change in value to specific market drivers:
-
Parallel Shift (SOFR10Y): Impact of a parallel movement in the long end of the curve.
-
Non-Parallel Shift (SOFR Swap + Treasury Rates, excluding SOFR10Y): Measures steepness/flatness of the yield curve.
-
Primary-Secondary Spread (PS Spread): Captures the impact of changes in mortgage rates.
-
Secondary-Secondary Spread (SS Spread): Focuses on secondary market pricing changes.
-
Volatility: Evaluates changes in implied market volatility.
-
Time (Aging): Reflects the effect of one additional day of passage.
Source: MIAC Analytics™
MIAC GSA Retrospective Analysis – Month-End Update
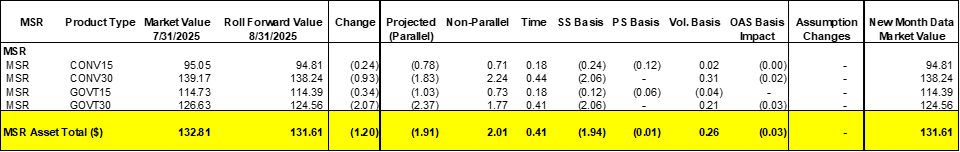
MIAC’s GSA Retrospective Analysis for the most recent period showed a modest decline in MSR values. From July 31 to August 31, 2025, MIAC’s benchmark servicing portfolio fell by 1.20 basis points, with weakness concentrated in longer-duration cohorts.
Parallel curve shifts were the primary driver of the decline (–1.91 bps), while favorable non-parallel curve dynamics (+2.01 bps) and positive time effects (+0.41 bps) provided partial offsets. Basis performance was mixed: servicing spread (SS) basis detracted –1.94 bps, prepayment spread (PS) basis was essentially flat (–0.01 bps), volatility basis added +0.26 bps, and OAS basis contributed –0.03 bps.
By product type, the largest declines came from 30-year Government (–2.07 bps) and 30-year Conventional (–0.93 bps) MSRs, both pressured by curve shifts and wider spreads. Shorter-duration 15-year cohorts experienced smaller pullbacks, with 15-year Conventional (–0.24 bps) and 15-year Government (–0.34 bps) MSRs declining more modestly.
These movements reflect external market dynamics, primarily curve shifts and spread widening, rather than any structural or credit assumption changes.
Despite recent weakness, MSR pricing multiples remain historically strong, with investor demand continuing to support healthy execution, particularly for clean-performing portfolios.
Source: MIAC Analytics™
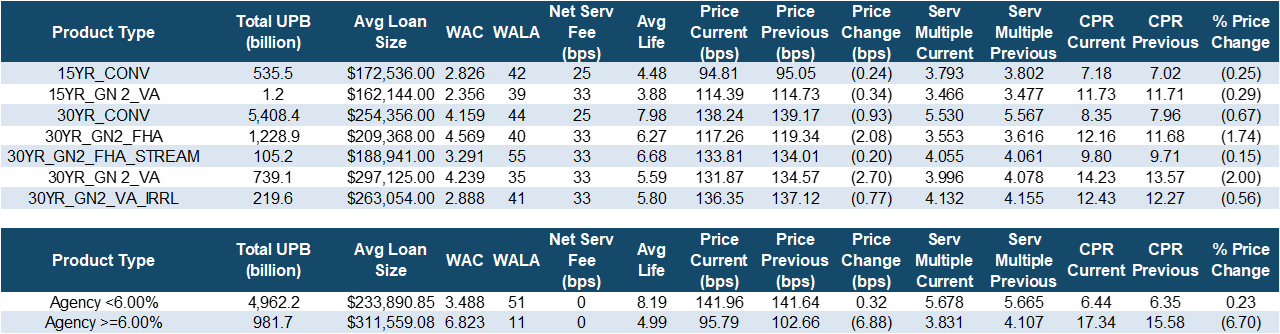
As illustrated, higher-WAC Agency MSRs (≥6.00%) experienced the steepest decline, with prices falling –6.88 bps and servicing multiples compressing from 4.11x to 3.83x. The driver saw a significant increase in prepayment expectations, as CPRs rose from 15.58% to 17.34%, combined with reduced float earnings. This segment remains the most exposed to Fed easing. That said, it can be where the most meaningful recapture benefit is recognized, providing some partial offset for servicers with strong borrower retention strategies.
Lower-WAC Agency MSRs (<6.00%) showed relative resilience. Prices ticked up +0.32 bps, and multiples held steady at around 5.68x. CPRs were largely unchanged, moving from 6.35% to 6.44%, underscoring that these pools retain some insulation given the limited refinance incentive. For this cohort, the impact is concentrated in float compression, not prepays.
Overall, the story is consistent: falling rates are creating clear headwinds for MSR values, but the effect is highly coupon dependent. Higher-WAC MSRs are feeling the brunt of higher prepay expectations and lower float income, though partially cushioned by recapture. Lower-WAC MSRs remain better insulated from prepay risk, with float earnings as the primary pressure point.
Bulk Pricing Update
The U.S. Treasury 10-year ended August at 4.23%, essentially unchanged from earlier in the summer and down only modestly from 4.37% in July. While long-end rates have remained relatively sticky, primary mortgage rates have declined more noticeably, sharpening refinance incentives. Against this backdrop, investor appetite for servicing assets remains strong, with many Agency MSR portfolios trading in the 5.5x to 6.0x range, depending on collateral quality and portfolio size.
Execution levels remain sensitive to collateral quality, geographic concentration, historical performance, and the relative moneyness of the loans. Larger offerings, often $10 billion or greater in UPB, appear to continue to have the best chance of clearing at or above 6x, while well-structured portfolios with clean performance, longer expected lives, larger balances, and strong note rate spreads continue to attract stronger investor interest.
Traditional assumptions around lifetime turnover are also being challenged. MIAC has observed successful trades at projected lifetime CPRs in the mid-4% range, paired with unlevered yields in the mid- to low-8s. This underscores the importance of valuation frameworks calibrated to current market behavior, not legacy assumptions.
Government MSR execution remains more variable. Stronger portfolios can trade above 4.50x, while weaker offerings continue to clear at discounted levels.
With rates declining and volatility returning, borrower recapture has become increasingly important. Buyers continue to model aggressive retention assumptions, regardless of the seller’s capabilities. In some trades, the difference between a seller with no recapture and a buyer modeling 30%+ retention has approached 1.0x for high-WAC segments. For firms unable to capture that value internally, selling in today’s market provides a way to monetize value that might otherwise remain unrealized.
This is especially relevant for firms under LOCOM accounting, where recent rate-driven gains have created cushions between book and market. These cushions can narrow quickly if prepays accelerate or MSR supply increases. Acting now can allow sellers to lock in execution while transferring prepay risk and recapture upside to buyers equipped to manage them.
Ginnie Mae Delinquencies Update
In August, GNMA servicers reported $3.87 billion in total loss-mitigation–related removals. These include not only workouts but also liquidations, charge-offs, and other involuntary resolutions. Despite this activity, the D60+ delinquent balance increased to $114.3B from $110.3B in July. Seasonal factors, including holiday spending and consumer cash-flow pressures, often contribute to rising delinquencies in the second half of the year.
Portfolio performance varies widely. 60 servicers, including 16 with over $1B in GNMA MSRs, have DQ3% at or above 4.5%. Another 95 servicers, including 29 billion-dollar platforms, report total delinquency rates above 10%.
Market concentration is high. Out of 298 GNMA servicers with at least one MSR:
- The top 3 control 42.6% of UPB.
- The top 10 control 71.8% of UPB.
- The top 20 manage 84.6% of UPB.
This concentration underscores the outsized role of large servicers in managing GNMA delinquency pipelines, while smaller platforms face greater variability.
Summary
Lower rates and steeper prepay curves are exerting more pressure on higher-WAC MSRs than on lower-WAC MSRs. Buyers with strong recapture capabilities continue to focus on higher-WAC portfolios, while lower-WAC portfolios attract investors seeking longer expected life and relative stability. For sellers, this bifurcation highlights the importance of WAC stratification and assessing execution opportunities across both segments. MIAC’s auction platform and brokerage services help clients align strategies with market dynamics.
About MIAC
Before contemplating any MSR valuation or brokerage exercise, consider the following:
- In business since 1989, MIAC has been providing asset valuation services for 36 years
- MIAC’s MSR valuation team is led by seasoned industry professionals with over 50 years of combined MSR valuation and brokerage experience
- MIAC’s MSR valuation team is made up of 11 professionals, with the shortest tenured individual at nearly 8 years
- Not including other asset types, in 2024, MIAC valued residential MSRs totaling $48.95T in unpaid principal balance for over 200 institutions
- In 2024, MIAC valued commercial mortgage MSRs totaling $1.7T for approximately 40 institutions
- Since 2021, has brokered or served as a buy-side advisor for nearly $600 B in residential and commercial MSRs
Author, Mike Carnes, Managing Director, MSR Valuations Group Mike.Carnes@miacanalytics.com
Disclosures: The material and analysis provided by or through MIAC is not a recommendation that must be followed or an offer, or solicitation of an offer to buy or sell any financial product; MIAC does not recommend that you enter into a particular transaction or represent that any product or service described here is suitable for you or your company. Nor is any information displayed here promoting any particular trading strategy in any jurisdiction where such an offer or solicitation, or trading strategy may be prohibited. As all prudent investors know, some transactions, including but without limitation, those involving high-yield securities, give rise to substantial risk and any investment decision you may make is your own. You should not enter into any transactions unless you have fully understood all such risks and have independently determined that such transactions are appropriate for you. Any discussion of the risks contained herein with respect to any product should not be considered to be a disclosure of all risks or complete discussion of the risks mentioned.
The information presented here is accurate to the best of our knowledge and is based on information that has been provided to us. Certain information contained in this website constitutes “forward-looking statements,” which can be identified by the use of forward-looking terminology such as “may,” “will,” “should,” “seek,” “expect,” “anticipate,” “target,” “project,” “estimate,” “intend,” “continue,” “believe,” the negatives thereof, other variations thereon or comparable terminology. Due to various risks and uncertainties, actual events or results or the actual performance may differ materially from those reflected or contemplated in such forward-looking statements. All opinions and conclusions in this report reflect MIAC’s judgment as of this date and are subject to change. All analyses are based on certain assumptions noted herein and different assumptions could yield substantially different results. You are cautioned that there is no universally accepted method for analyzing financial instruments. You should review the assumptions; there may be differences between these assumptions and your actual business practices. Further, we do not guarantee any results and there is no guarantee as to the liquidity of the instruments involved in our analysis. The decision to adopt any strategy remains your responsibility.
Past performance is not necessarily indicative of future results and there can be no assurance that equivalent results will be achieved. MIAC does not make any representation or warranty, express or implied, regarding future performance. Targeted results are subjective and should not be construed as providing any assurance to the results that may be realized by MIAC in the future.
This document does not constitute, or form part of, an offer to purchase or issue interests in any security or investment product. Any such offer or solicitation will only be made only pursuant to the relevant subscription documents.