By Mike Carnes, Managing Director; Jennifer Howell, Managing Director; Nicholas Manolis, SVP – MIAC MSR Valuations Group
Fair Market Value Update
From end-of-month May to end-of-month June 2025, MIAC’s Primary 30-Year Mortgage Rate (C30 PMR) declined by approximately 27 basis points, while the benchmark earnings rate (5-Year SOFR) fell by roughly 18 basis points. These movements present fundamental headwinds for MSR valuations, as they increase prepayment expectations (particularly for higher note rate MSRs) and reduce float income—both of which negatively affect modeled servicing cash flows.
Nonetheless, the MSR market continues to trade at or near historic highs, with execution multiples remaining elevated. This resilience is supported by several factors beyond base cash flow modeling. For portfolios with higher weighted-average note rates, recapture potential remains a key value driver—particularly for sellers with strong retention platforms. Additionally, cross-sell opportunities embedded in longer-duration MSRs help some buyers justify premium pricing, especially in segments with deeper customer engagement or extended servicing horizons.
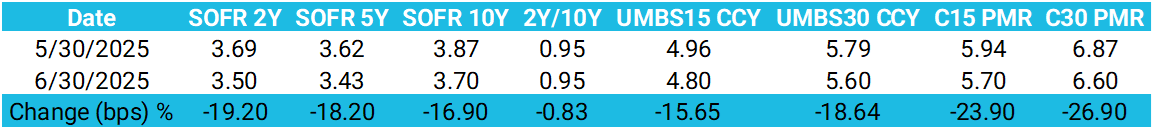
Source: MIAC Analytics™ – CCY data derived from MIAC’s proprietary TBA Fixings™ and CCY Fixings™ platforms as of May 30 and June 30, 2025.
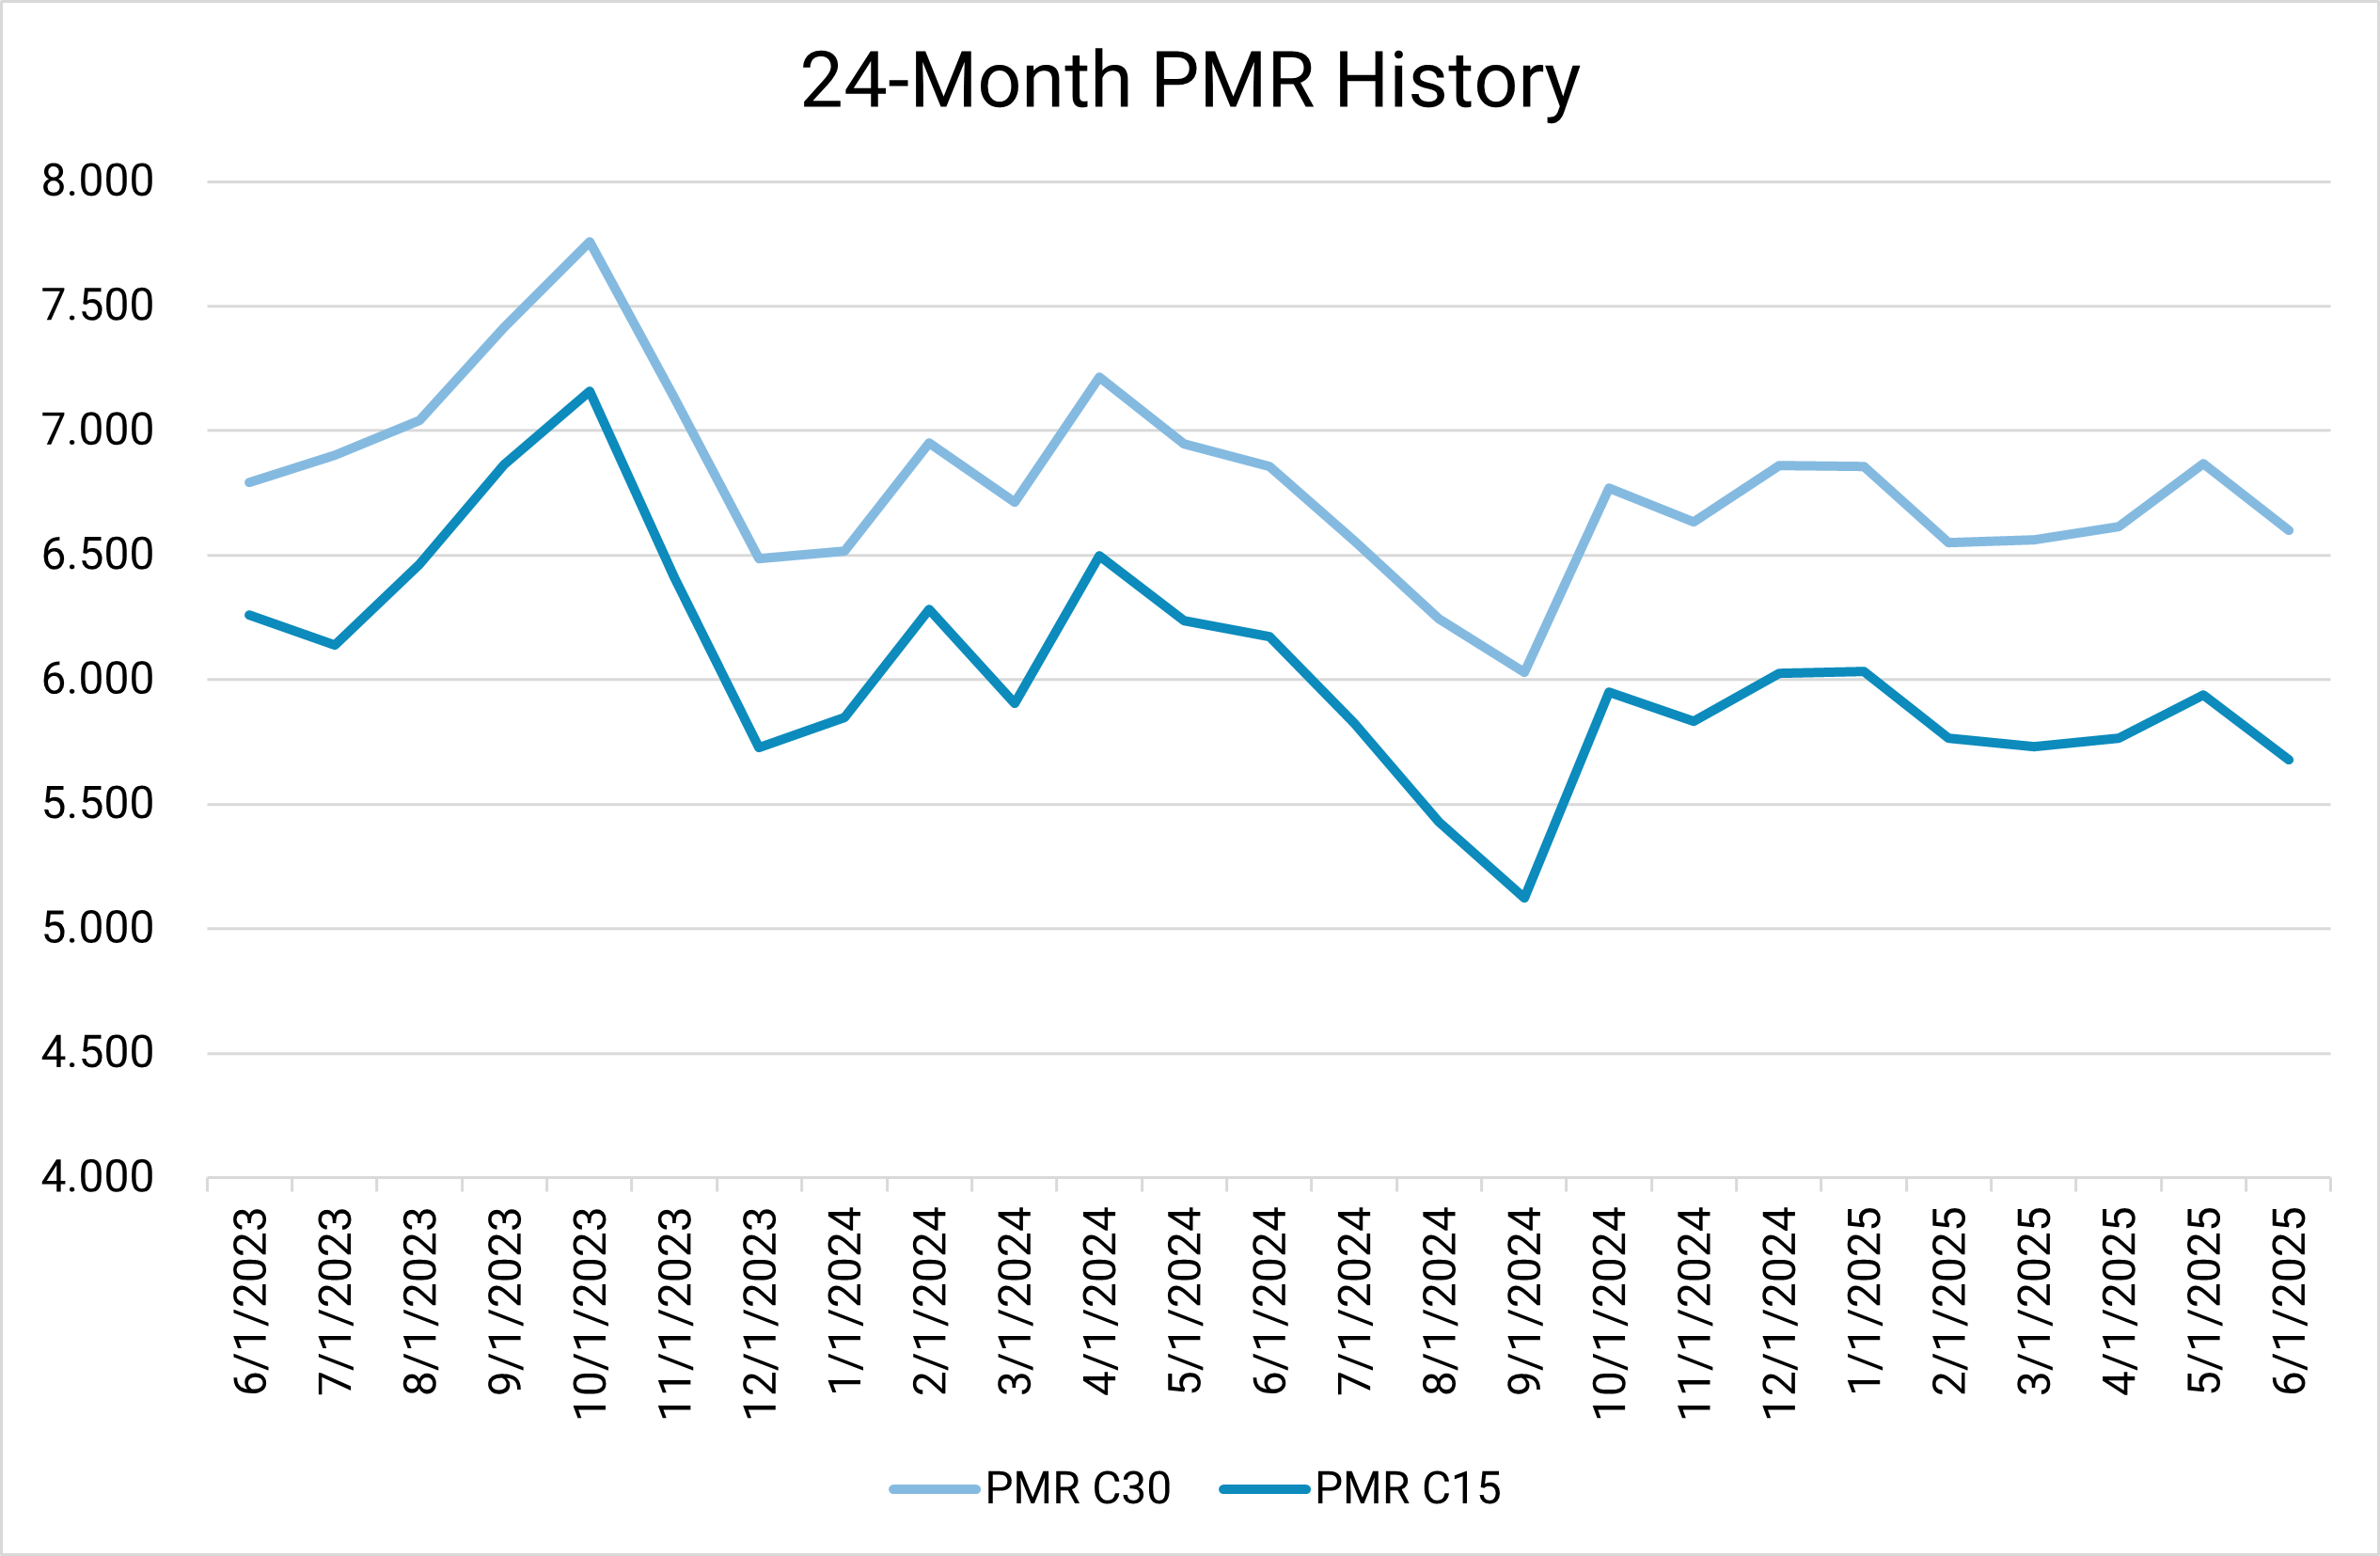
Source: MIAC Analytics™
MIAC’s Retrospective Analysis: Attribution Framework
MIAC’s Retrospective Analysis provides a detailed evaluation of the performance of your MSR and/or hedge positions over a defined period (e.g., daily, weekly, or monthly). With reference to the month-over-month GSA Retrospective Analysis shown below, the observed changes in value can be attributed to the following key market drivers:
-
Parallel Shift (SOFR10Y): Captures the impact of a parallel movement in the long end of the curve. The analysis is run as of Day 0, substituting only the SOFR10Y rate from Day 1 to recalculate the market value.
-
Non-Parallel Shift (SOFR Swap + Treasury Rates, excluding SOFR10Y): Measures the steepness or flatness of the yield curve. The analysis uses all Day 1 rates—except SOFR10Y—while holding all other variables constant from Day 0.
-
Primary-Secondary Spread (PS Spread): Assesses the impact of changes in mortgage rates. The Day 0 analysis is rerun using the Day 1 PS Spread to determine its influence on market value.
-
Secondary-Secondary Spread (SS Spread): Also measures mortgage rate impact but focuses on movements in secondary pricing. The analysis is conducted by applying the Day 1 SS Spread to the Day 0 framework.
-
Volatility: Evaluates changes in implied market volatility. The volatility surface from Day 1 is applied to the Day 0 environment to isolate its effect on market value.
-
Time (Aging): Isolates the effect of time decay. The analysis is conducted as of Day 1, with all other inputs held constant from Day 0, to reflect the impact of one additional day of passage.
Source: MIAC Analytics™
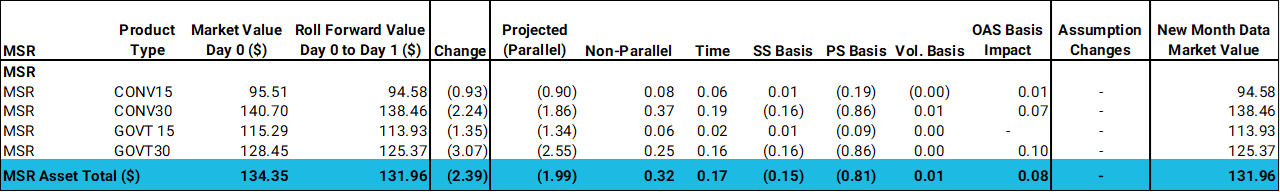
MIAC’s GSA Retrospective Analysis for the month of June showed a modest but broad-based decline in MSR values. From end-of-May to end-of-June, MIAC’s representative benchmark servicing portfolio decreased by 2.39 basis points, driven by market-based changes in both modeled prepayment speeds and earnings rates.
The decline was consistent with expectations given the interest rate environment. The 10-year Treasury fell from 4.41% to 4.24%, and the resulting drop in primary mortgage rates increased refinance incentives. This dynamic led to higher modeled CPRs. In parallel, a decline in the 5-Year SOFR reduced the benchmark earnings rate used in MIAC’s valuation framework. Together, these factors contributed to lower MSR values—particularly for high-WAC and longer-duration cohorts, which are more sensitive to prepayment and earnings assumptions.
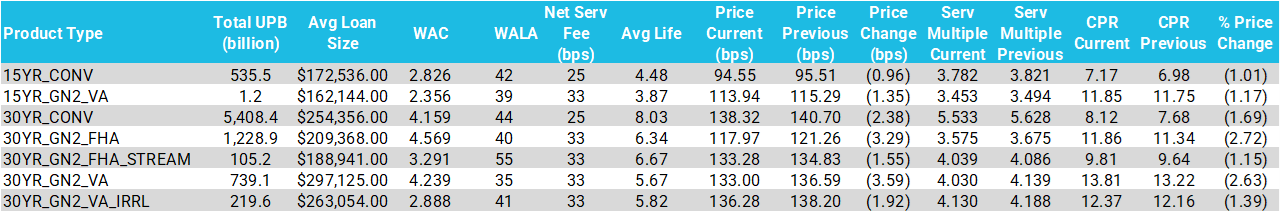
As reflected in MIAC’s in Generic Servicing Assets™ (GSAs), the softest performance was observed in the 30-year Ginnie Mae and Conventional segments, while other products experienced more muted changes. These valuation movements were driven by external market factors, not by changes in credit quality or structural assumptions.
Despite the modest pullback, pricing multiples appear to remain historically strong, and investor appetite continues to support healthy execution—especially for well-structured, clean-performing portfolios. MIAC will continue to monitor prevailing market trends, including liquidity conditions, to ensure our valuation assumptions remain well-aligned with current market behavior.
Source: MIAC Analytics™
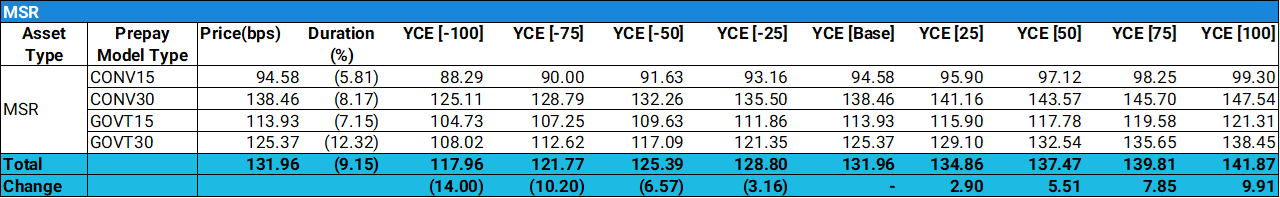
GSA Rate Shock Curve – Value Sensitivity Overview
The rate shock curve below illustrates the interest rate sensitivity of MIAC’s GSAs™ as of end-of-month June. A +100 basis point parallel shift in rates results in a +9.91 basis point increase in value, while a -100 basis point shift produces a -14.00 basis point decline. This convexity profile—characterized by steady value appreciation in rising rate environments and more pronounced compression when rates decline—remains consistent across asset types and is broadly in line with historical MSR behavior.
The asymmetric response highlights the need for thoughtful risk management—whether through direct hedging strategies, natural balance sheet offsets, or disciplined exposure monitoring. As interest rate cycles remain unpredictable, understanding this convexity dynamic is critical to help safeguard servicing valuations and navigate market volatility with confidence.
Source: MIAC Analytics™
Bulk Pricing Update
The U.S. Treasury 10-year ended June at 4.24%, down modestly from 4.41% in May. While rate movement over the past month has been relatively modest, investor appetite for servicing assets remains strong. Still, the majority of Agency MSR portfolios continue to trade in the 5.0x to 6.0x range. Execution levels remain highly sensitive to a number of factors—including credit quality, geographic concentration, historical performance, and the relative moneyness of the underlying loans. Larger offerings—often defined as $10 billion or greater in UPB—have the best chance of clearing above the 6x threshold, thanks to the scale, liquidity, and optionality they offer buyers. Select portfolios that combine clean performance, longer expected lives, larger balances, and strong note rate spreads are still commanding mid- to high-6x multiples, reaffirming that premium pricing remains achievable under the right conditions. As always, realistic pricing expectations and strategic market positioning remain essential.
For years, conventional wisdom held that “normal” turnover translated to a minimum lifetime CPR of 6%, but recent executions continue to challenge that narrative. At MIAC, we’ve observed successful trades at projected lifetime CPRs in the mid-4% range, often paired with unlevered yields in the mid- to low-8s. These outcomes highlight a continued evolution in how buyers are calibrating risk and reinforce the importance of precise, data-driven valuation frameworks that reflect current—not legacy—market behavior.
Execution levels for Government MSRs remain more variable than their conventional counterparts. While stronger portfolios are drawing premiums—often trading north of 4.50x, depending on performance—lesser-quality offerings continue to clear at discounted levels. As always, credit quality and delinquency performance are the primary pricing drivers.
Recent trades confirm that select lower note rate Ginnie Mae portfolios—backed by strong credit quality and clean performance metrics—can command multiples in the low to mid-5x range, though such pricing remains limited to a small subset of sellers. Not all servicers have the portfolio strength to achieve these levels.
As of June month-end, 55 of the 298 Ginnie Mae servicers—including 17 with more than $1 billion in UPB—reported a 90+ day delinquency rate (DQ3%) of 4.5% or higher. More broadly, 87 servicers, including 31 billion-dollar platforms, are now reporting total delinquency rates above 10%, underscoring continued sector stress.
While reported delinquencies have declined modestly over the past quarter, this improvement has been largely driven by elevated loan buyouts, including borrowers who subsequently qualify for modifications. In June alone, $3.03 billion of Ginnie Mae loans were bought out—down from $4.07 billion in May—but still reflective of persistently high workout volumes.
At the same time, the total 60+ day delinquent balance (D60+) increased to $108.4 billion in June, up from $104.7 billion in May. Now that we’re past the typical seasonal lift from tax refund season, delinquencies may rise further through the remainder of the year.
With interest rate volatility returning and the MSR market continuing to evolve, borrower recapture has only grown in strategic importance. Recent trades and live deal activity confirm that buyers are still pricing in aggressive recapture assumptions—often irrespective of whether the seller has any internal capability to retain borrowers. This dynamic continues to create a rare opportunity for sellers to monetize value that would otherwise remain permanently unrealized.
The backdrop for this opportunity is increasingly fluid. With the current administration openly criticizing Fed Chair Powell and calling for rate cuts, the political pressure on the Fed is intensifying. While the Fed maintains its independence, the rhetoric alone has already introduced renewed volatility and speculation around future monetary policy shifts. If rates do decline in the coming quarters—as both markets and policymakers appear to be signaling—it would only enhance recapture opportunities, making the current MSR market even more favorable for buyers with strong refinance infrastructure.
In this environment, buyers are still paying premiums for the future value they believe they can extract—even if the selling party lacks the platform to do so. The difference is quantifiable: in some trades, the execution multiple for a 0% recapture seller versus a buyer modeling 30%+ retention has approached 1.0x for high-WAC segments. For firms unable to access that value internally, selling into this market can effectively bridge the gap between realized cash flow and full market value.
This isn’t just a story about platform strength—it’s also a story about strategic timing. For firms operating under LOCOM accounting, the recent rate-driven rise in MSR marks has created meaningful cushions between book and market. But these cushions won’t last forever. While falling rates may support recapture, they also raise prepay risk and can narrow those cushions quickly. Selling now allows sellers to lock in value that may disappear if the rate environment shifts too quickly or if future MSR supply grows.
Ultimately, the market is temporarily offering sellers credit for value they may never extract on their own. For those with limited recapture capabilities or conservative accounting treatment, partial or full sales—especially of high-WAC, low-recapture segments—can generate premium execution. Knowing your limitations isn’t a weakness in this market; it’s a strategic advantage.
Ginnie Mae Delinquencies Update
After a seasonal decline earlier in the year—driven by tax refund activity and significant Early Buyout (EBO) volume—Ginnie Mae delinquencies have resumed their upward trajectory. As of the end of June, the total 60+ day delinquent balance (D60+) rose to $108.4 billion, up from $104.7 billion in May. With the temporary lift from tax season now behind us, delinquencies may continue to climb through year-end, particularly in regions facing intensified affordability pressures.
MIAC remains concerned about the broader trajectory of Ginnie Mae credit performance. In several high-exposure states, rising homeowners insurance costs are placing additional strain on borrower capacity—especially in markets already contending with high housing costs and stagnant income growth. Simultaneously, a growing number of loans are aging into late-stage delinquency, where traditional loss mitigation strategies become less effective and borrower re-engagement rates decline. Markets at greater risk of home price depreciation may also present heightened credit concerns, as declining equity limits both exit strategies and the viability of conventional workout options.
Judicial foreclosure timelines remain a major bottleneck, particularly in jurisdictions like New York City and Chicago, where resolution times have substantially lengthened relative to pre-pandemic norms. These extended timelines place prolonged advance obligations on servicers, which are especially burdensome for non-bank entities navigating tighter liquidity and persistently high capital costs. Compounding the issue, delays have also intensified in certain non-judicial states, where local regulatory constraints and residual pandemic-era bottlenecks have further slowed the default resolution process. These delays not only inflate servicing costs but also hinder servicers’ ability to efficiently manage and rotate capital.
All of this is unfolding against a deteriorating macroeconomic backdrop. Sticky inflation in essential household expenses—potentially exacerbated by new tariff-driven price pressures—is undermining borrower resilience, particularly across Ginnie Mae’s lower-income segments. These macro risks are further amplified by loan-level characteristics such as elevated LTVs and DTIs, which remain widespread across many cohorts.
While recent data may suggest a short-term stabilization, MIAC continues to view Ginnie Mae credit fundamentals as structurally fragile. Absent renewed federal support or a meaningful rebound in borrower capacity, the risk of sustained credit deterioration remains elevated—underscoring the importance of proactive risk management and disciplined loss modeling across Ginnie Mae portfolios.
About MIAC
Before contemplating any MSR valuation or brokerage exercise, consider the following:
- In business since 1989, MIAC has been providing asset valuation services for 36 years
- MIAC’s MSR valuation team is led by seasoned industry professionals with over 50 years of combined MSR valuation and brokerage experience
- MIAC’s MSR valuation team is made up of 11 professionals, with the shortest tenured individual at nearly 8 years
- Not including other asset types, in 2024, MIAC valued residential MSRs totaling $48.95T in unpaid principal balance for over 200 institutions
- In 2024, MIAC valued commercial mortgage MSRs totaling $1.7T for approximately 40 institutions
- Since 2021, has brokered or served as a buyside advisor for nearly $600 B in residential and commercial MSRs
Author, Mike Carnes, Managing Director, MSR Valuations Group Mike.Carnes@miacanalytics.com
Contributor, Jennifer Howell, Managing Director, MSR Valuations Group Jennifer.Howell@miacanalytics.com
Contributor, Nicholas Manolis, Senior Vice President, MSR Valuations Group Nicholas.Manolis@miacanalytics.com
Disclosures: The material and analysis provided by or through MIAC is not a recommendation that must be followed or an offer, or solicitation of an offer to buy or sell any financial product; MIAC does not recommend that you enter into a particular transaction or represent that any product or service described here is suitable for you or your company. Nor is any information displayed here promoting any particular trading strategy in any jurisdiction where such an offer or solicitation, or trading strategy may be prohibited. As all prudent investors know, some transactions, including but without limitation, those involving high-yield securities, give rise to substantial risk and any investment decision you may make is your own. You should not enter into any transactions unless you have fully understood all such risks and have independently determined that such transactions are appropriate for you. Any discussion of the risks contained herein with respect to any product should not be considered to be a disclosure of all risks or complete discussion of the risks mentioned.
The information presented here is accurate to the best of our knowledge and is based on information that has been provided to us. Certain information contained in this website constitutes “forward-looking statements,” which can be identified by the use of forward-looking terminology such as “may,” “will,” “should,” “seek,” “expect,” “anticipate,” “target,” “project,” “estimate,” “intend,” “continue,” “believe,” the negatives thereof, other variations thereon or comparable terminology. Due to various risks and uncertainties, actual events or results or the actual performance may differ materially from those reflected or contemplated in such forward-looking statements. All opinions and conclusions in this report reflect MIAC’s judgment as of this date and are subject to change. All analyses are based on certain assumptions noted herein and different assumptions could yield substantially different results. You are cautioned that there is no universally accepted method for analyzing financial instruments. You should review the assumptions; there may be differences between these assumptions and your actual business practices. Further, we do not guarantee any results and there is no guarantee as to the liquidity of the instruments involved in our analysis. The decision to adopt any strategy remains your responsibility.
Past performance is not necessarily indicative of future results and there can be no assurance that equivalent results will be achieved. MIAC does not make any representation or warranty, express or implied, regarding future performance. Targeted results are subjective and should not be construed as providing any assurance to the results that may be realized by MIAC in the future.
This document does not constitute, or form part of, an offer to purchase or issue interests in any security or investment product. Any such offer or solicitation will only be made only pursuant to the relevant subscription documents.