By Mike Carnes, Managing Director – MIAC MSR Valuations Group
Fair Market Value Update
Following the Federal Reserve’s recent 25-basis-point rate cut, mortgage rates initially moved lower but have since leveled off. Market sentiment has moderated in response to Chair Powell’s recent comments, which suggested that additional rate reductions in 2025 are not guaranteed.
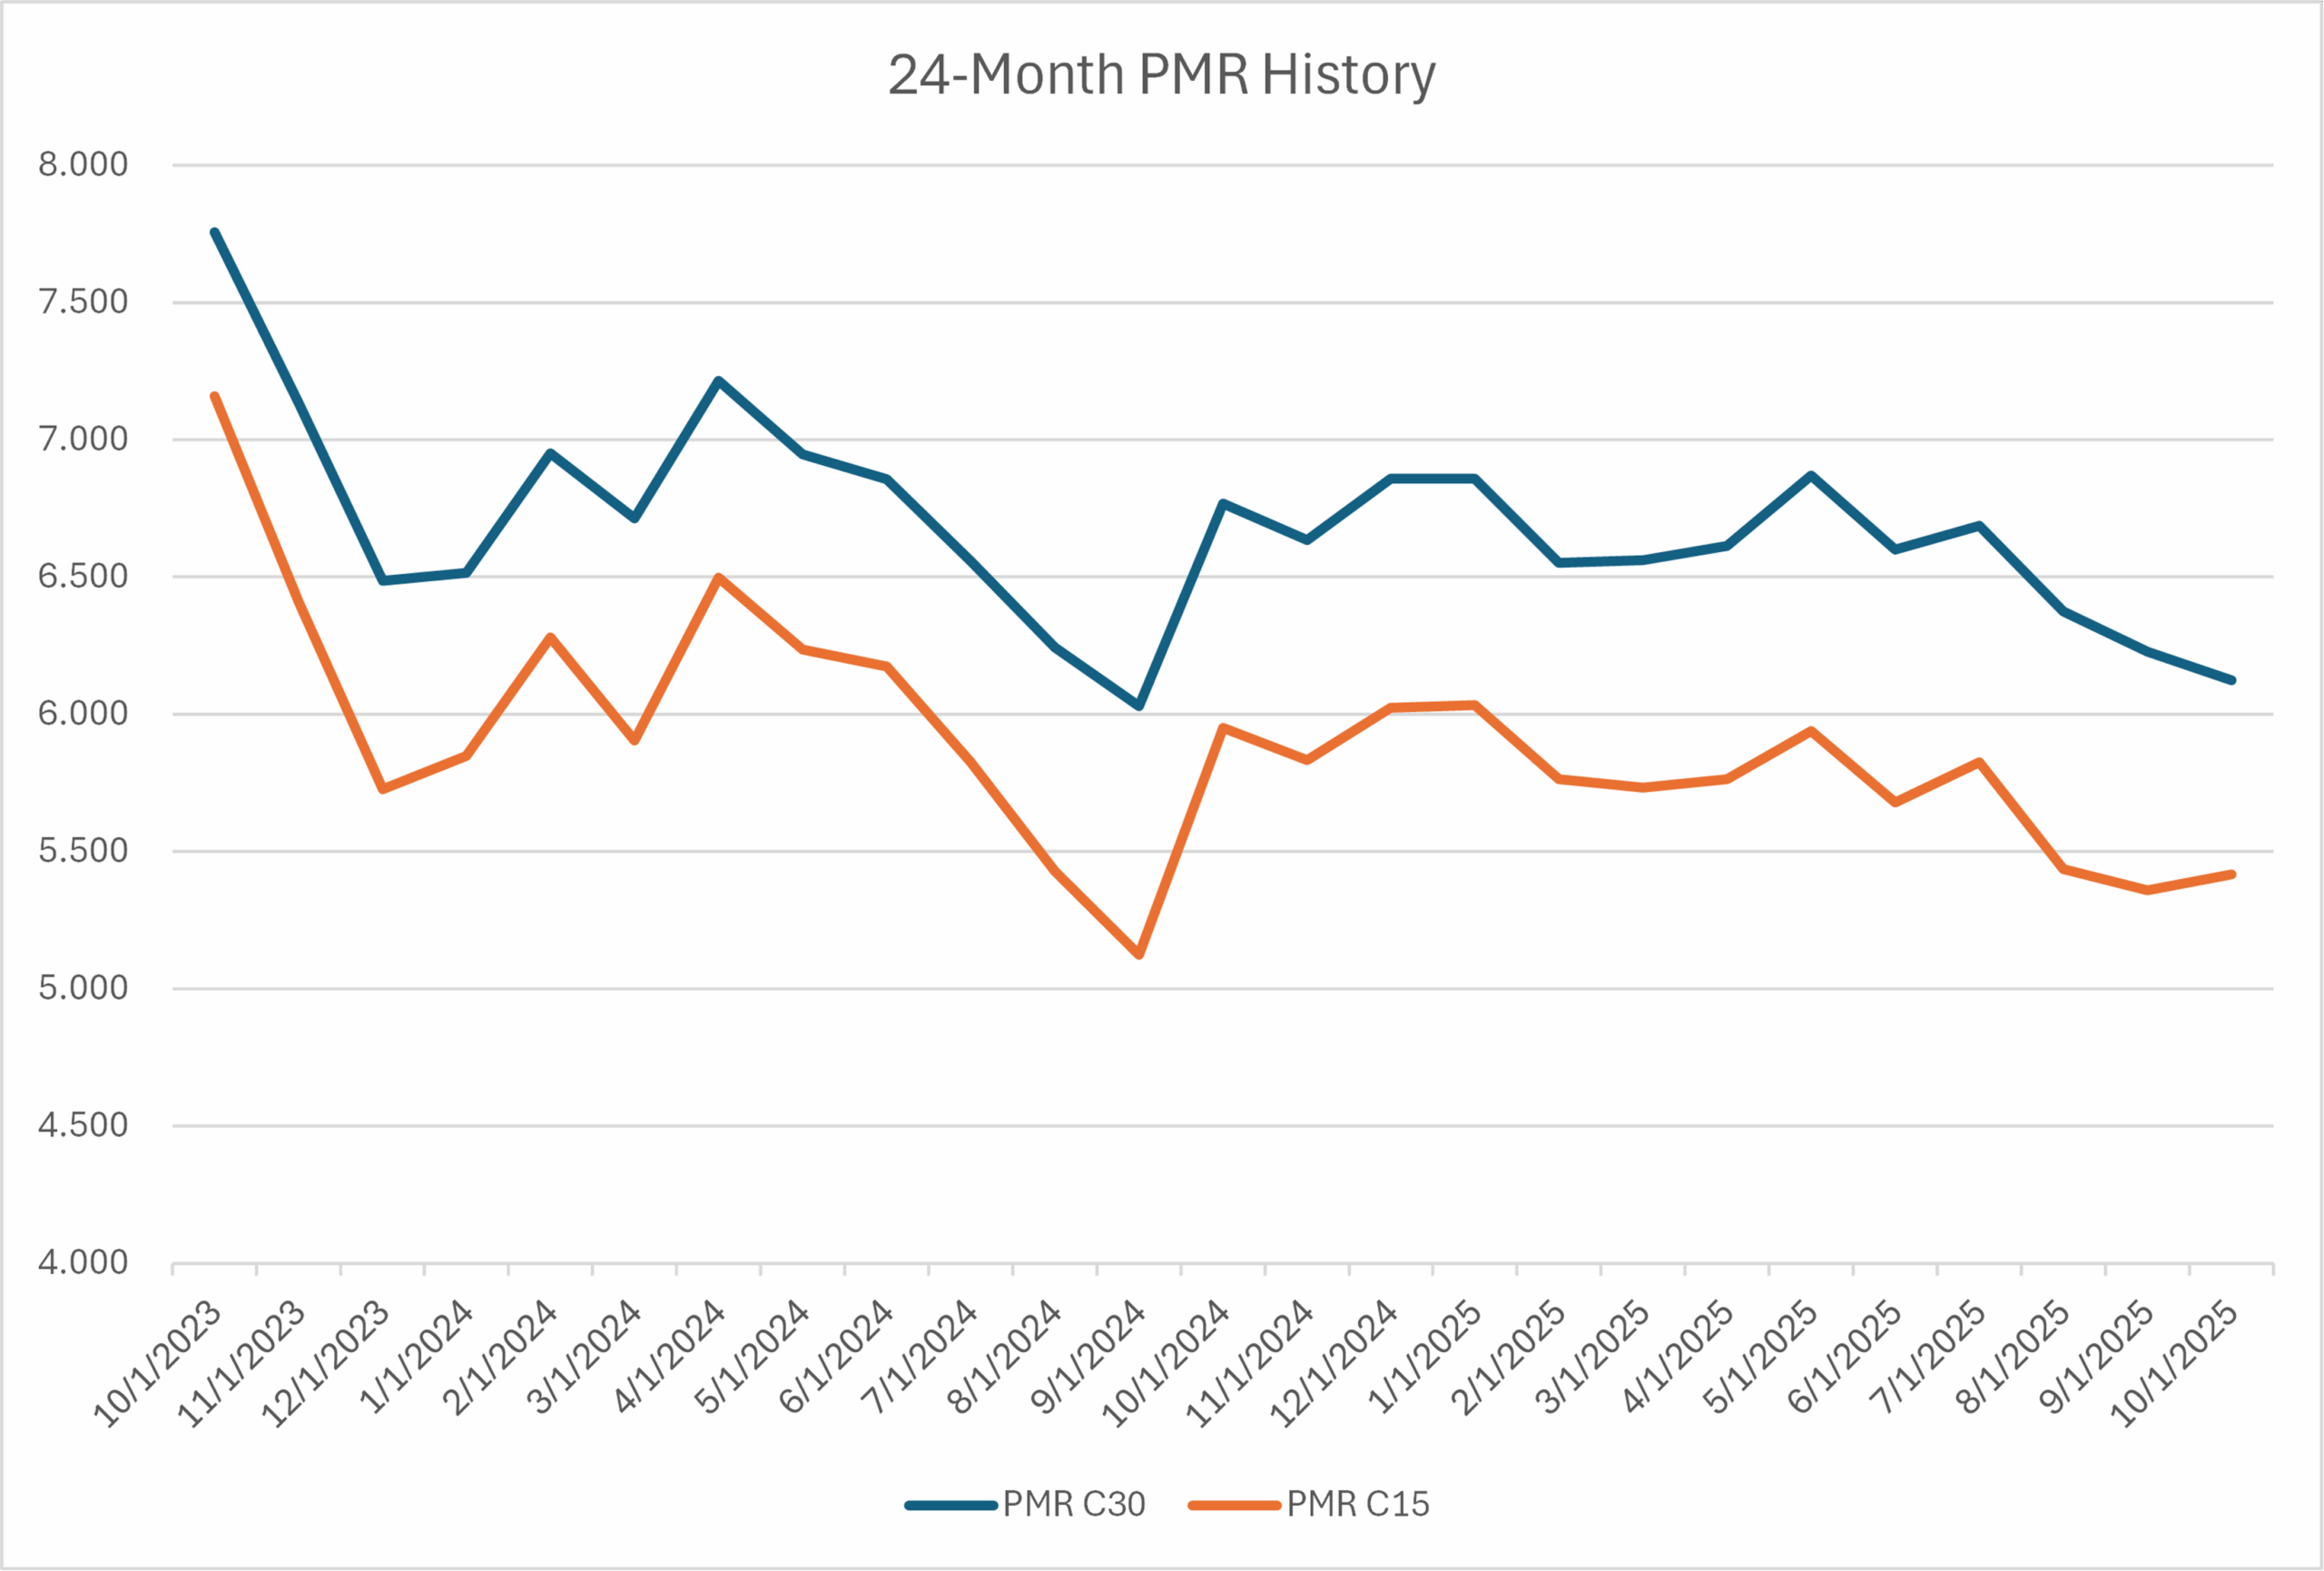
MIAC’s Base Mortgage Rate declined from 6.60% at the end of June to 6.37% at the end of August, and currently stands at 6.12% following the rate cut. The approximately 50-basis-point decline over that period reflects market adjustments made prior to and immediately following the Fed’s decision.

Source: MIAC Analytics – CCY data derived from MIAC’s proprietary TBA Fixings™ and CCY Fixings™ platforms.
While MSR values have remained generally resilient, the rally in rates during the summer months contributed to modest value compression as prepayment expectations increased. In the current environment, execution levels remain supported, though pricing on certain higher-WAC assets has shown greater sensitivity to rate movements.
A continued distinction can be observed between higher- and lower-WAC MSRs:
- Higher-WAC portfolios have been more affected by rate declines due to higher refinancing propensity. These assets tend to attract investors with recapture or cross-sell platforms that can partially mitigate value impact.
- Lower-WAC portfolios remain appealing to investors seeking stable, longer-duration cash flows. Although float income has declined modestly, these assets remain less exposed to accelerated prepayments, offering greater cash-flow predictability.
For institutions without recapture capabilities, a competitive-bid sale process may help identify execution opportunities, particularly for higher-WAC or LOCOM-accounted portfolios. Conversely, lower-WAC MSRs may align more closely with investors focused on duration stability and reduced convexity exposure.
Source: MIAC Analytics
Recapture and Portfolio Strategy
While rate movements have driven modest compression in MSR values, investor behavior continues to vary widely depending on recapture capability and portfolio composition. This makes recapture strategy an increasingly important consideration in today’s market.
If the Fed continues along a path of monetary easing, recapture and the portfolio strategy surrounding it will become increasingly critical as MSR values begin to decline. While COVID-era originations remain relatively insulated from significant prepayment acceleration, newer, higher-WAC production would experience sharper value declines as prepayment speeds pick up.
As long as MSR buyers continue to incorporate recapture value into their bid prices, the market values of higher-WAC MSRs should not fall as rapidly as some prepayment models might imply. Recapture effectively offsets a portion of the price decline associated with higher prepayments. However, in a falling-rate environment, firms with limited or no recapture capability will likely see their economic value fall more sharply than their market value.
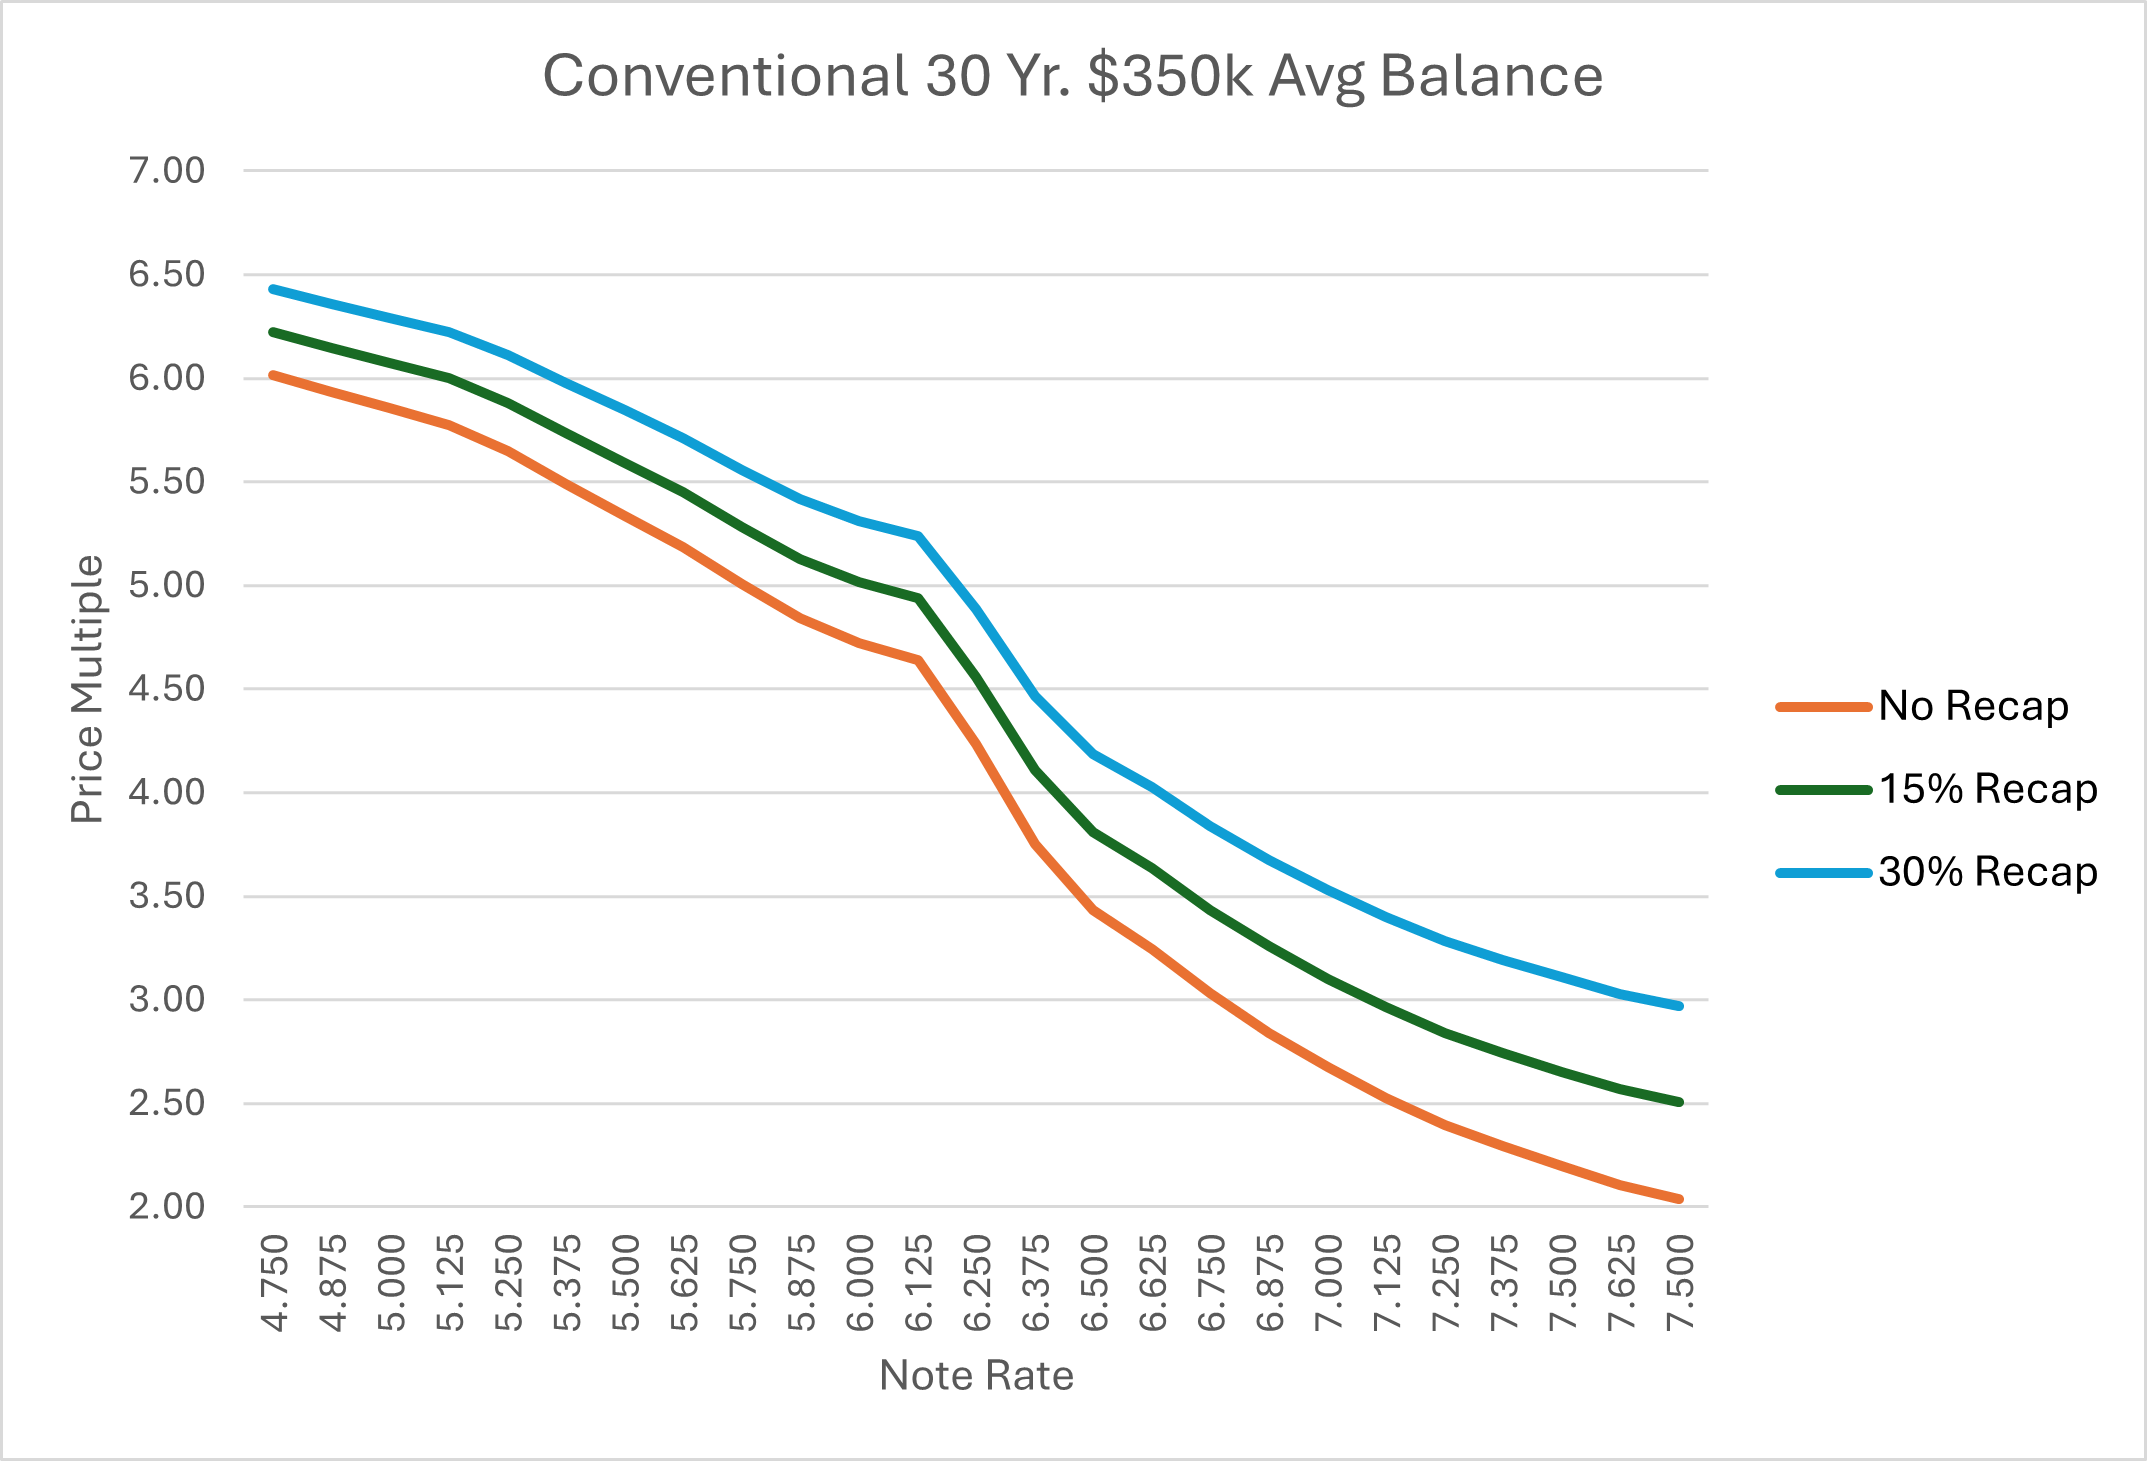
Source: MIAC Analytics
Conventional 30-year loans represented in the graph are assumed to be new originations with a FICO of 720, LTV of 80%, national average escrow balance, and prepayment behavior based on national averages.
Firms lacking internal recapture capability continue to view the current environment as a favorable exit opportunity, a view that may strengthen as economic and market values diverge if rates decline further. Monetizing MSRs while valuations remain near post-2022 highs may be the most effective way for these firms to realize full portfolio value.
This dynamic could lead to further consolidation in the MSR market, as larger buyers with established recapture platforms consistently outbid non-recapture participants, often by 0.25x to 0.50x multiples or more.
The market’s ongoing willingness to compensate sellers for recapture, regardless of the seller’s own ability to capture it, has created a unique opportunity for firms with limited recapture infrastructure to benefit from buyers’ economies of scale. Understanding the difference between your internal recapture capabilities and the market’s pricing of recapture value is essential to any long-term servicing strategy.
MIAC Retrospective Analysis: Attribution Framework
MIAC’s Retrospective Analysis provides a detailed evaluation of the performance of MSR and/or hedge positions over a defined period (daily, weekly, or monthly). The framework attributes change in value to specific market drivers:
- Parallel Shift (SOFR10Y): Impact of a parallel movement in the long end of the curve.
- Non-Parallel Shift (SOFR Swap + Treasury Rates, excluding SOFR10Y): Measures steepness/flatness of the yield curve.
- Primary-Secondary Spread (PS Spread): Captures the impact of changes in mortgage rates.
- Secondary-Secondary Spread (SS Spread): Focuses on secondary market pricing changes.
- Volatility: Evaluates changes in implied market volatility.
- Time (Aging): Reflects the effect of one additional day of passage.
Source: MIAC Analytics
MIAC GSA Retrospective Analysis – Month-End Update
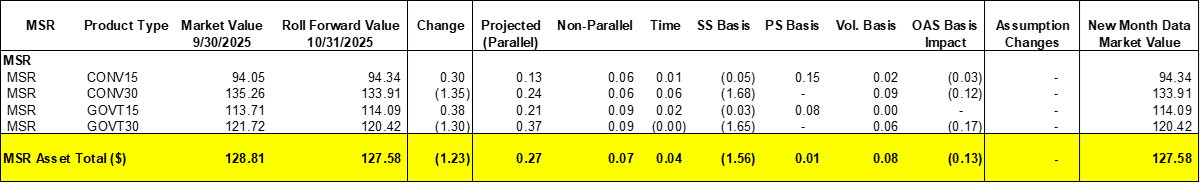
MIAC’s GSA Retrospective Analysis for the period ended October 31, 2025, reflected a modest decline of 1.23 basis points in overall MSR values compared with September 30, 2025. The weakness was primarily concentrated in longer-duration 30-year cohorts, while 15-year products posted modest gains.
Parallel curve movements accounted for +0.27 bps, with smaller contributions from non-parallel curve shifts (+0.07 bps) and time effects (+0.04 bps). Basis components were mixed: the servicing-spread (SS) basis detracted –1.56 bps, the prepayment-spread (PS) basis added a small +0.01 bps, and the volatility basis contributed +0.08 bps. The OAS basis detracted –0.13 bps, while there were no material assumption changes during the period.
By product type:
- Conventional 15-year MSRs rose +0.30 bps, supported by curve and spread stability.
- Conventional 30-year MSRs fell –1.35 bps, driven by wider servicing-spread basis moves.
- Government 15-year MSRs increased +0.38 bps, aided by favorable curve effects.
- Government 30-year MSRs declined –1.30 bps, reflecting curve-related pressure and modest basis widening.
The observed movements largely reflect external market dynamics, primarily curve shifts and spread changes, rather than any structural or credit-related assumption revisions.
Despite the modest month-over-month decline, aggregate MSR pricing levels remain historically firm, with healthy buyer participation continuing to support execution across clean, performing portfolios.
Coupon and Product Performance Analysis
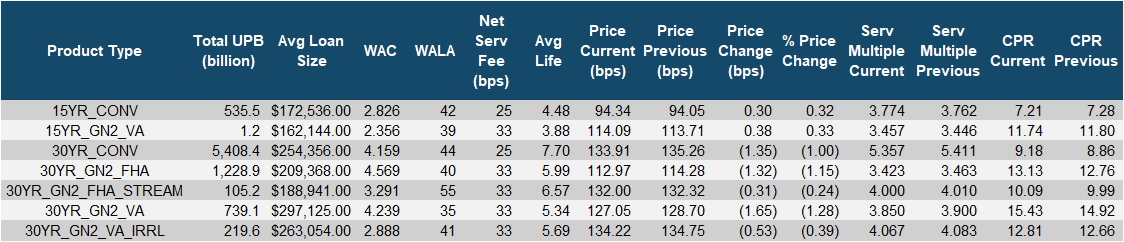
Source: MIAC Analytics
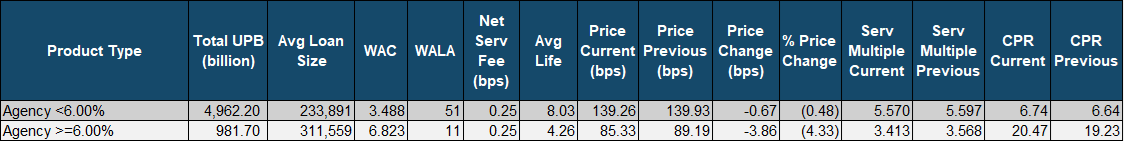
As illustrated, higher-WAC Agency MSRs (≥6.00%) experienced the most notable month-over-month decline. Prices fell –3.86 bps, while servicing multiples compressed from 3.57x to 3.41x. The decline was driven by an increase in prepayment expectations, as CPRs rose from 19.23% to 20.47%, combined with modest reductions in float income. This segment remains the most sensitive to rate movements and is typically where servicers with established recapture platforms can offset a portion of the value pressure through retained borrower activity.
Lower-WAC Agency MSRs (<6.00%) showed relative resilience. Prices slipped only –0.67 bps, with servicing multiples holding essentially steady (5.60x to 5.57x). CPRs were nearly unchanged, rising slightly from 6.64% to 6.74%, underscoring that refinance incentive remains limited for this cohort. For these portfolios, the primary headwind continues to be float compression rather than accelerated prepayments.
At the product level, the strongest performers were 15-year Conventional (+0.30 bps) and 15-year GNMA VA (+0.38 bps) MSRs, both supported by curve stability and limited prepay sensitivity. Larger declines occurred in 30-year GNMA VA (–1.65 bps) and 30-year Conventional (–1.35 bps) MSRs, consistent with their higher rate exposure and greater refinance elasticity.
Overall, October’s data show that falling rates and lower float returns are contributing to moderate value compression across the MSR market, with the magnitude varying by coupon. Higher-WAC MSRs remain most affected by prepay expectations but benefit partially from recapture economics, while lower-WAC MSRs continue to offer greater duration stability and insulation from rate volatility.
Bulk Pricing Update
The U.S. Treasury 10-year ended October at roughly 4.11%, down about 5 basis points from 4.16% at the end of September, following the Federal Reserve’s 25-basis-point rate cut. While long-term rates declined modestly, primary mortgage rates fell more sharply, increasing refinance incentives and contributing to slight compression in MSR values during the month.
Even with this softening, investor appetite for servicing assets remains strong. Most Agency MSR portfolios continue to trade in the 5.25x–5.75x range, with well-seasoned, geographically diversified portfolios and clean performance still capable of clearing near or above 6.0x. Pricing remains sensitive to collateral characteristics, note-rate dispersion, historical servicing performance, and expected float income.
Higher-WAC assets experienced the greatest pressure as prepayment expectations rose and float income declined, whereas lower-WAC portfolios remained comparatively stable. Despite this compression, MSRs continue to stand out as a durable, income-producing asset class, offering attractive risk-adjusted yields and a natural hedge against origination-driven earnings volatility.
In the Government MSR segment, execution remains mixed. High-quality GNMA portfolios with low delinquency rates and balanced geography continue to trade in the 4.25x–4.75x range, while smaller or higher-risk packages generally transact at discounts.
Buyers continue to differentiate execution based on recapture potential. The pricing spread between sellers without recapture capabilities and buyers modeling 25–35% retention can approach 0.75x to 1.00x for higher-WAC assets. For firms without borrower retention platforms, current market conditions still offer an opportunity to monetize embedded value while transferring both prepayment and recapture risk to investors equipped to manage them.
For institutions reporting under LOCOM accounting, the recent rally has narrowed cushions between book and market value. With execution levels still historically elevated and liquidity strong, taking advantage of current bid depth can allow sellers to secure attractive pricing before further prepay acceleration or additional market value compression occurs.
Ginnie Mae Delinquencies Update
For the most recent reporting month (September 2025), Ginnie Mae servicers reported approximately $3.69 billion in total loss-mitigation–related removals. This figure includes completed workouts as well as liquidations, charge-offs, and other involuntary resolutions.
Despite this activity, the 60-plus-day delinquent balance increased to $116.6 billion, up from $114.3 billion in August. The rise is broadly consistent with seasonal patterns, as consumer cash-flow pressures and higher household spending in late summer and early fall typically contribute to modest delinquency upticks during the second half of the year.
As discussed during MIAC’s recent webinar, longer foreclosure timelines, particularly in judicial states, continue to influence reported delinquency balances. These extended timelines mean that loans remain in delinquent status for longer periods even as servicers pursue resolution strategies, contributing to persistently elevated 60-plus-day balances despite steady loss-mitigation activity.
Portfolio performance remains uneven across servicers:
- 67 servicers, including 20 with more than $1 billion in GNMA MSRs, reported 90-plus-day delinquency rates at or above 4.5%.
- An additional 93 servicers, including 29 billion-dollar platforms, posted total delinquency rates exceeding 10%.
Market concentration remains significant:
- The top 3 servicers control 42.4% of Ginnie Mae UPB.
- The top 10 collectively manage 71.5%, and the top 20 oversee 84.4% of total UPB.
This concentration underscores the outsized role of large servicers in managing Ginnie Mae delinquency pipelines, while smaller and mid-tier platforms continue to experience greater variability in performance outcomes, an operational dynamic further influenced by the extended foreclosure resolution cycles highlighted in MIAC’s webinar discussion.
Summary and Outlook
Despite the recent rate cut and renewed volatility in fixed-income markets, the MSR sector remains one of the most stable and attractive risk-adjusted yield opportunities in the broader mortgage finance landscape. While value compression has emerged as refinancing incentives increased, pricing levels remain historically strong, supported by robust liquidity and healthy investor demand across both Agency and Government portfolios.
The market continues to reward portfolio quality, clean performance, and recapture capability. Higher-WAC assets are showing greater sensitivity to prepayment expectations, while lower-WAC portfolios continue to offer longer-duration stability and consistent cash-flow characteristics. For institutions without borrower-retention platforms, competitive-bid execution remains a practical means of realizing full market value while transferring prepay and recapture risk to well-positioned buyers.
In the Government segment, delinquency trends bear continued monitoring as seasonal pressures and portfolio concentration among large servicers shape market dynamics heading into year-end. Nonetheless, GNMA MSR execution levels remain supported, particularly for strongly performing portfolios with low delinquency and balanced geographic exposure.
Overall, the combination of elevated demand, solid execution, and active portfolio rotation underscores a market that remains fundamentally healthy, even amid modest rate-driven valuation pressure. As the rate environment stabilizes, MSRs continue to serve as a critical source of income, balance-sheet diversification, and long-term portfolio value for both investors and originators alike.
About MIAC
Before contemplating any MSR valuation or brokerage exercise, consider the following:
- In business since 1989, MIAC has been providing asset valuation services for 36 years
- MIAC’s MSR valuation team is led by seasoned industry professionals with over 50 years of combined MSR valuation and brokerage experience
- MIAC’s MSR valuation team is made up of 11 professionals, with the shortest tenured individual at nearly 8 years
- Not including other asset types, in 2024, MIAC valued residential MSRs totaling $48.95T in unpaid principal balance for over 200 institutions
- In 2024, MIAC valued commercial mortgage MSRs totaling $1.7T for approximately 40 institutions
- Since 2021, has brokered or served as a buy-side advisor for nearly $600 B in residential and commercial MSRs
Author, Mike Carnes, Managing Director, MSR Valuations Group Mike.Carnes@miacanalytics.com
Disclosures: The material and analysis provided by or through MIAC is not a recommendation that must be followed or an offer, or solicitation of an offer to buy or sell any financial product; MIAC does not recommend that you enter into a particular transaction or represent that any product or service described here is suitable for you or your company. Nor is any information displayed here promoting any particular trading strategy in any jurisdiction where such an offer or solicitation, or trading strategy may be prohibited. As all prudent investors know, some transactions, including but without limitation, those involving high-yield securities, give rise to substantial risk and any investment decision you may make is your own. You should not enter into any transactions unless you have fully understood all such risks and have independently determined that such transactions are appropriate for you. Any discussion of the risks contained herein with respect to any product should not be considered to be a disclosure of all risks or complete discussion of the risks mentioned.
The information presented here is accurate to the best of our knowledge and is based on information that has been provided to us. Certain information contained in this website constitutes “forward-looking statements,” which can be identified by the use of forward-looking terminology such as “may,” “will,” “should,” “seek,” “expect,” “anticipate,” “target,” “project,” “estimate,” “intend,” “continue,” “believe,” the negatives thereof, other variations thereon or comparable terminology. Due to various risks and uncertainties, actual events or results or the actual performance may differ materially from those reflected or contemplated in such forward-looking statements. All opinions and conclusions in this report reflect MIAC’s judgment as of this date and are subject to change. All analyses are based on certain assumptions noted herein and different assumptions could yield substantially different results. You are cautioned that there is no universally accepted method for analyzing financial instruments. You should review the assumptions; there may be differences between these assumptions and your actual business practices. Further, we do not guarantee any results and there is no guarantee as to the liquidity of the instruments involved in our analysis. The decision to adopt any strategy remains your responsibility.
Past performance is not necessarily indicative of future results and there can be no assurance that equivalent results will be achieved. MIAC does not make any representation or warranty, express or implied, regarding future performance. Targeted results are subjective and should not be construed as providing any assurance to the results that may be realized by MIAC in the future.
This document does not constitute, or form part of, an offer to purchase or issue interests in any security or investment product. Any such offer or solicitation will only be made only pursuant to the relevant subscription documents.